The second issue of our beautiful newsletter! I hope we run into less technical problems this time aaaah! I had whole thing planned out for this week’s newsletter, but some personal stuff came up that I want to talk about instead. I also realized that’s kind of the point of this weekly thing: I should journal about the week, more than plan out elaborate entertainment. Before you read any further, this issue is going to be a bit existential. Make sure to read the trigger warnings below and decide if you’re up for it.
Trigger warnings: surgery, cancer and death.
How am I doing?
One of my friends has an upcoming surgery that will put him through an incredibly taxing rehabilitation procedure. Even then, he will permanently be severely impaired. EVEN THEN, he will only have a few years left to live. It’s caused by a brain tumor that he’s known about for a while now.
So this weekend, he came over with some other friends in an impromptu fashion. We hung out, played board games, drank too much and chatted. It was good old fun and cathartic, but in retrospect it feels a bit bittersweet. It made me think about the time we have left and how we spend it.
For a few years now I have been thinking about what I want my life to be like. It’s the reason I took the opportunity to do all this; the newsletter, building a community, stepping away from a stable job. A weekend like this really puts the emphasis on what I am doing versus what I want to do.
What am I doing?
I have been tracking my “work” hours using Clockify, a free time tracking software. It spits out pie charts with colors for all the projects I’m working on. I composited a little graph below for the weeks since my unemployment.
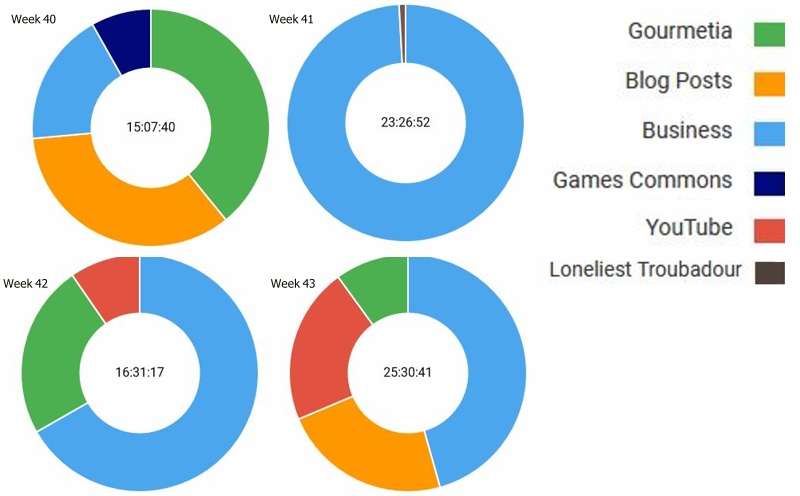
Right now, Business Blue is dominating most of my charts. It includes all the setup I have to do regarding starting a company: administration, social media presence, updating my toolchains and website etc. These are all things I don’t love but are necessary to facilitate what I do love.
What I would love is for the pie charts to contain as many colors as possible! I love working on multiple projects at the same time. I want to spend my days chasing whatever ephemeral interest I have at that moment. My new goal is to maintain a rainbow pie chart: a project for each color on the visible spectrum.
Why am I doing? (this)
I had doubts about my choice to not return to a well-paid, stable job. It’s pretty scary to throw out security and stability like that. But now, with renewed fervor after this weekend, I feel like that is the right choice. I’m fully aware none of it might pan out, but every day I wake up and feel excited about trying anyway.
I’m wondering what my pie charts would look like if I tracked non-work things as well. My social engagements, the concerts I go to, sports, what-have-you. I think it’s already a beautiful palette! Do you love your pie chart? What chromatic beauty would you add to it, given the chance?
Daan signing off. Make sure to spend time with your loved ones if you can!